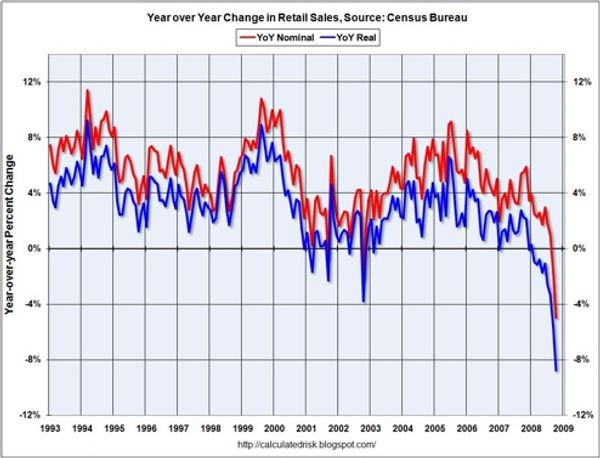
A Nice Chart Showing How Poor You Are
Here's a frightening math chart from the mathies at Calculated Risk putting that record 2.8% October retail sales decline in perspective. (As if a record drop in consumer spending needed more perspective!) Sales are down 8.8% on a year-over-year basis, which may just strike you as, "bah, some dumb number," but this graph shows that that is what we call a "free fall."
It is important for the supply-siders to realize that giving more money to the "investor class" at the expense of others won't help much now, because who would invest in a company thatcan't sell any products since no one has any money or credit?
Christ, how many more days must we wait for Obama to come in and dish out those $20k Hope Checks we're all getting? It so SO MANY DAYS. Obama will arrive just in time to bail out Citigroup. You know, the biggest company in the world. This will be an opportunity for Americans to learn a delightful new word: "unbailoutable."
Retail sales plunge record 2.8% in October [Marketwatch]
Retail Sales Collapse In October [Calculated Risk]
Citi's Desperate Straight [Portfolio]


